When analyzing or debugging complex code it can be a great help to have a call graph at your disposal. In this article we look at Python's bundled trace module to generate a call graph and at jsPlumb, a Javascript library to render an interactive visual representation.
Trace can do more than coverage analysis
In a previous article we saw how we could use Python'strace module to see which lines in in our code where actually executed when we run some function. The same module can provide us with a list of functions that are called by other functions. This is as simple as providing some extra parameters as can be seen in the example code below:import trace t=trace.Trace(count=1,trace=0,countfuncs=1,countcallers=1) t.runfunc(f) r=t.results()This snippet will run the function
f and in the end we will have a CoverageResults object in r. We can print these results with the write_results() method but a more graphical representation is preferred. Now the underlying data structures are not well documented some inspection and examination of the source code shows that we have a member called callers that hold a record of which function called which. It is a dictionary with a a complex key and a simple value: the value contains a count of how many times in a function another function is called, the key is a tuple of tuples (caller, callee) where eacht member has three parts: (module, filename, functionname). Lets see how we can use this information to visualize the call graph.jsPlumb
 The idea is to represent each function as a simple box and draw lines to indicate which function calls which other function. Now we could try to build an application based on some graphics library but rendering graphical boxes is something web browser are good at, so why not use HTML to represent our graph and a web browser to render the stuff? All we need is some way to draw attractive lines connecting those boxes. Enter jsPlumb, a versatile Javascript libraray to do just that. And a lot more as well: once a graph is drawn it lets you interact with the boxes to rearrange them as you see fit.
The example code provided at the end of this article will generate a number of
div elements, one for each Python function encountered. It also generates a bit of Javascript to let jsPlumb draw its connecting lines. The HTML produced looks like this:
<html><head>
<script type="text/javascript" src="http://explorercanvas.googlecode.com/svn/trunk/excanvas.js"></script>
<script type="text/javascript" src="http://ajax.googleapis.com/ajax/libs/jquery/1.4.4/jquery.min.js"></script>
<script type="text/javascript" src="http://ajax.googleapis.com/ajax/libs/jqueryui/1.8.2/jquery-ui.min.js"></script>
<script type="text/javascript" src="jquery.jsPlumb-1.2.5-all-min.js "></script>
<link rel="stylesheet" href="callgraph.css" type="text/css" media="all" />
</head><body>
<div id="i" class="box" style="left:200px;top:200px">i</div>
<div id="h" class="box" style="left:200px;top:400px">h</div>
<div id="Trace-runfunc" class="box" style="left:200px;top:100px">Trace-runfunc</div>
<div id="g" class="box" style="left:200px;top:300px">g</div>
<div id="f" class="box" style="left:300px;top:200px">f</div>
<script>
jsPlumb.Defaults.Connector = new jsPlumb.Connectors.Bezier(50);
jsPlumb.Defaults.DragOptions = { cursor: 'pointer', zIndex:2000 };
jsPlumb.Defaults.PaintStyle = { strokeStyle:'gray', lineWidth:2 };
jsPlumb.Defaults.EndpointStyle = { radius:7, fillStyle:'gray' };
jsPlumb.Defaults.Anchors = [ "BottomCenter", "TopCenter" ];

$("#Trace-runfunc").plumb({target:"f"});
$("#g").plumb({target:"i"});
$("#f").plumb({target:"g"});
$("#g").plumb({target:"h"});
</script>
</body></html>
It consists of a number of script tags to include the jQuery library and jsPlumb together with the explorer canvas so everything will work on Internet Explorer just as well.Next is a list of
div elements with a box class and a final script elements that calls the plumb method for each connection. This final bit of Javascript is preceded by a few lines that set some default for the lines that will be drawn. These are fully documented on the jsPlumb site.
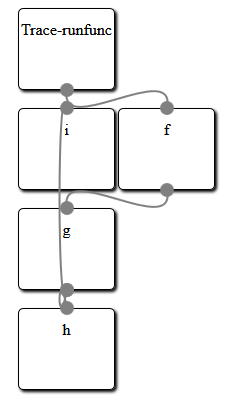
When this HTML and Javascript is viewed with a webbrowser the result looks something like the image preceding the HTML sample code. Creating a layout for a graph where nothing overlaps is a difficult job and clearly fails here, but the beauty of jsPlumb is that it provides an interactive graph: you can click and drag any box on the screen to rearrange the graph in any way. An example is shown in the image on the left where we have dragged about some of the boxes to provide a clear separation.
From CoverageResults to an interactive graph
So our problem boils down to generating suitable HTML and Javascript from the data provided in theCoverageResults object. I'll provide the full code without much explanation as it should be clear enough. It certainly isn't a sterling example of clean coding but it works:
def f():
 for i in range(10):
  g(i)

def g(n):
 return h(n)+i(n)

def h(n):
 return n+10

def i(n):
 return n*8

def box(name,pos=(400,300)):
 return ('<div id="%s" class="box" style="left:%dpx;top:%dpx">%s</div>'
   %(name,pos[0],pos[1],name))

def connect(f,t):
 return '$("#%s").plumb({target:"%s"});'%(f,t)

if __name__ == "__main__":
 import trace
 from random import randint

 t=trace.Trace(count=1,trace=0,countfuncs=1,countcallers=1)
 t.runfunc(f)
 r=t.results()

 print("""<html><head>
<script type="text/javascript" src="http://explorercanvas.googlecode.com/svn/trunk/excanvas.js"></script>
<script type="text/javascript" src="http://ajax.googleapis.com/ajax/libs/jquery/1.4.4/jquery.min.js"></script>
<script type="text/javascript" src="http://ajax.googleapis.com/ajax/libs/jqueryui/1.8.2/jquery-ui.min.js"></script>
<script type="text/javascript" src="jquery.jsPlumb-1.2.5-all-min.js "></script>
<link rel="stylesheet" href="callgraph.css" type="text/css" media="all" />
</head><body>""")

 boxen={} # unique names, values are positions
 for f,t in r.callers:
  fk=f[2].replace('.','-') # identifiers with dots cannot be used as (x)html ids
  tk=t[2].replace('.','-')
  if not fk in boxen:
   boxen[fk]=[200,100]
  if not tk in boxen:
   boxen[tk]=[200,100]
  boxen[tk][1]=boxen[fk][1]+100
 for b in boxen:
  for b2 in boxen:
   if b != b2 and boxen[b] == boxen[b2]:
    boxen[b2][0]+=100
 for b in boxen:
  print(box(b,boxen[b]))

 print("""<script>
jsPlumb.Defaults.Connector = new jsPlumb.Connectors.Bezier(50);
jsPlumb.Defaults.DragOptions = { cursor: 'pointer', zIndex:2000 };
jsPlumb.Defaults.PaintStyle = { strokeStyle:'gray', lineWidth:2 };
jsPlumb.Defaults.EndpointStyle = { radius:7, fillStyle:'gray' };
jsPlumb.Defaults.Anchors = [ "BottomCenter", "TopCenter" ];
""")
 for f,t in r.callers:
  fk=f[2].replace('.','-')
  tk=t[2].replace('.','-')
  print(connect(fk,tk))
 print("</script>")
 print("</body></html>")

