Showing posts with label jQueryUI. Show all posts

A jQuery Mobile Address plugin

While playing around with jQuery Mobile and wondering about the support for the new HTML5 input types I realized there wasn't an address extension that was just as easy to use a date picker was for dates. So I wrote an address plug-in.

Adding Google Maps to an input element

The idea is very simple: addresses are text just like an e-mail address or an url. HTML5 makes it possible to identify this a input element types and jQuery Mobile acts on these types as well to display custom widgets for these elements.

I wanted an address type: an input element with that type would allow the user to enter an address or a click on it would open an interactive map. Clicking on a location in that map would fill in the address under the cursor. Writing such a plug-in was a fine exercise in both jQuery Mobile and the Google Maps API and the first results are documented on my website as part of the Erica Web Application framework.

Windows 7 Gadgets: mini web applications

Windows 7 gadgets are small applications that are integrated in the Windows desktop. These gadgets are basically webpages displayed in a browser environment that hardly differs from a regular environment. It is therefore entirely possible to turn a gadget into a web application that retrieves data from a remote server with AJAX. In this article we explore some of the possibilities and see how we may use jQuery inside a gadget.

Anatomy of a Windows 7 gadget

There is actually some pretty decent documentation on gadgets available on the web (for example on msdn or here). The trick is to get an example gadget running with as little ballast as possible.

A gadget file is basically a zip file that contains a file gadget.html plus a number of additional files, the most important one, gadget.xml. This zip file does have a .gadget extension instead of a .zip extension. So these simple steps are needed to create a bare bones gadget:

  1. Create a directory with a descriptive name, e.g. mygadget
  2. In this directory create a file gadget.html
  3. a subdirectory named css with a file mygadget.css
  4. a file gadget.xml
  5. and finally a file icon.png
  6. pack the contents of this directory into a file mygadget.zip (i.e. not the toplevel directory itself)
  7. rename this file to mygadget.gadget (although 7zip for example can pack to a file with any extension directly)
  8. double click this file and follow through the install dialog

With the following gadget.html the result will look like the screenshot

<html xmlns="http://www.w3.org/1999/xhtml">
<head>	
	<title>My Gadget</title>
	<meta http-equiv="Content-Type" content="text/html; charset=unicode" />
	<link href="css/mygadget.css" rel="stylesheet" type="text/css" /> 
</head>
<body> 
<div id="main_image">
<p>42</p>
</div>
</body>
</html>

Not really impressive, I admit, but it shows how simple it is to create a gadget. The necessary gadget.xml mainly describes were to find the actual html code and what image to use in the gadget selector:
<?xml version="1.0" encoding="utf-8" ?>
<gadget>
  <name>Mygadget</name>
  <namespace><!--_locComment_text="{Locked}"-->StartSmall.Gadgets</namespace>
    <version><!--_locComment_text="{Locked}"-->1.0</version>
  <author name="Michel Anders">
    <info url="http://michelanders.blogspot.com" text="Start Small" />
    <logo src="icon.png" />
  </author>
  <copyright><!--_locComment_text="{Locked}"-->&#169; 2011</copyright>
  <description>Basic Gadget</description>
  <icons>
    <icon height="48" width="48" src="icon.png" />
  </icons>
  <hosts>
    <host name="sidebar">
      <base type="HTML" apiVersion="1.0.0" src="gadget.html" />
      <permissions>
        <!--_locComment_text="{Locked}"-->Full
      </permissions>
      <platform minPlatformVersion="1.0" />
    </host>
  </hosts>
</gadget>

Using jQuery in a Windows 7 gadget

Displaying static information is not much fun at all so let's see what options there are to create a more dynamic gadget:

  • Refer to external content like images that get refreshed
  • Refresh the content ourselves using JavaScript, possibly even interacting with the user
The first option is simple enough and we won't cover that here. The second option is more interesting because it opens up a whole array of possibilities. Let's have a look at how a gadget.html page should look to incorporate jQuery and how we can test if this works:
<html xmlns="http://www.w3.org/1999/xhtml">
<head>	
	<title>My Gadget</title>
	<meta http-equiv="Content-Type" content="text/html; charset=unicode" />
	<link href="css/mygadget.css" rel="stylesheet" type="text/css" />
	<script src="http://ajax.googleapis.com/ajax/libs/jquery/1.6.1/jquery.min.js" type="text/javascript"></script>
</head>
<body> 
<div id="main_image">
<p>42</p>
</div>
<script type="text/javascript">$("#main_image p").append('<span> 43 44 45 </span>');</script>
</body>
</html>
As you can see this is surprisingly simple. The screenshot proves that the final lines of code are actually executed and change the contents of our basic gadget: Our next step is to check if we can retrieve data from a server.

JSONP in a Windows 7 gadget

Due to the same origin policy it is not entirely straight-forward to retrieve data from a server different from the server we get our webpage from. In the gadget environment every server is considered a different server because the gadget.html file originates from a file system. This means that even if we access a web application server on the same pc, we will be denied access.

Fortunately there is a workaround available in the form of JSONP and jQuery makes it very simple for use to use this. Consider the following gadget.html:

<html xmlns="http://www.w3.org/1999/xhtml">
<head>	
	<title>My Gadget</title>
	<meta http-equiv="Content-Type" content="text/html; charset=unicode" />
	<link href="css/mygadget.css" rel="stylesheet" type="text/css" />
	<script src="http://ajax.googleapis.com/ajax/libs/jquery/1.6.1/jquery.min.js" type="text/javascript"></script>
</head>
<body> 
<div id="main_image">
<p>42</p>
</div>
<script type="text/javascript">
function Refresh() {
    $.ajax('http://127.0.0.1:8088/value',
		{dataType:'jsonp',scriptCharset: "utf-8",
		success:function(data, textStatus, jqXHR){
			$("#main_image").empty().append('<p>'+String(data)+'</p>');
		}});
}
window.setInterval("Refresh()", 5000);
</script>
</body>
</html>

It will contact an application server every 5 seconds to retrieve a number and will insert this number into the content div. That's all there is to it. The application server that serves these request is equally simple and can be build for example with the applicationserver module from a previous article:

from http.server import HTTPServer, BaseHTTPRequestHandler
from json import dumps
from applicationserver import IsExposed,ApplicationRequestHandler

class Application:

	def value(self,callback:str,_:int=0) -> IsExposed:
		r = "%s(%s);"%(callback,dumps(_ % 17)) 
		return r
		
class MyAppHandler(ApplicationRequestHandler):
	application=Application()
	
appserver = HTTPServer(('',8088),MyAppHandler)
appserver.serve_forever()

The only trick here is that JSONP requests pass an additional paramter (usually called callback that will hold a string (the name of a JavaScript function in the client) and that we have to use this parameter to contruct a return value that looks like a call to this function with the JSON encoded data as its argument (line 8). The _ parameter holds a random number added by JQuery to prevent caching by the browser. So if _ happened to be 123 and callback would be jquery456_123 the value we woudl return would be the string jquery456_123(4);

The data we return here is merely a random number but of course this could be anything and we could style it to be presented in a more readable form.

A jQuery plugin to add icons to elements

In this article I present a simple jQuery plugin that adds suitable icons to a selection of elements based on the value of the rel attribute.

CSS3 :after selector not suitable?

If the target browser understands CSS3 we could add an icon with the help of the :after selector. This has a couple of disadvantages though:

  • Only the newest browsers support this,
  • Although it is possible to insert a url that points to an image, this element is magic, i.e. not visible in the DOM, so we cannot style it with CSS,
  • We can select elements based the contents of an attribute but we cannot construct and element based on the result of this selection.
Fortunately a flexible yet simple solution can be crafted in a few lines of Javascript with the help of the jQuery library.

The iconify plugin

The code presented below assumes that jQuery is already loaded. It is tested with jQuery 1.6.1 but should work with earlier versions just as well. Using the plugin is as simple as $("a").iconify();. This will add an icon (an <img> tag) to every link, if any of those links has a rel attribute. You need to provide a directory with suitable icons. For example, if you have links with rel="python", an icon will be added with a src attribute of src="Icons/python-icon.png"

The plugin can be broken down to a few simple steps. The first it does (in line 2) is to make sure the selection is a jQuery object. The next two lines make sure that if any of the parameters is missing the corresponding default is used.

In line 6 we then iterate over all elements of the selection and retrieve the rel attribute (line 8). If this attribute is present and not empty, we check if it can be found in the iconmap object, if not we construct a generic name (line 13). Next we construct an <img> element with a suitable src attribute and a meaningful alt attribute and add this element to the current element in the iteration. Finally (line 24) we return the original selection to allow this plugin to be chained just like most jQuery functions.

$.fn.iconify = function (icondir,iconmap) {
 var $this = $(this);
 icondir = icondir || $.fn.iconify.icondir;
 iconmap = iconmap || $.fn.iconify.iconmap;
 
 $this.each(function(i,e){
  e=$(e);
  var rel=e.attr('rel');
  var src="";
  var alt="";
  
  if(rel !== undefined && rel != ''){
   if(iconmap[rel]!==undefined){
    src='src="'+icondir+'/'+iconmap[rel]+'"';
   }else{
    src='src="'+icondir+'/'+rel+'-icon.png'+'"';
   }
   alt='alt="'+rel+' icon"';
   var img=$('');
   e.append(img);
  }
 });
 
 return $this;
};
$.fn.iconify.icondir='Icons';
$.fn.iconify.iconmap={
'python' :'python-logo-24.png',
'blender' :'blender-logo-24.png',
'photo'  :'camera-logo-24.png',
'wikipedia' :'wikipedia-logo-24.png'
};

The CSS rel attribute

Using the rel attribute for this purpose might be considered misuse (see for example this page) so you might consider rewriting the plugin to check another attribute, for instance class.

Visualizing Python call graphs with jsPlumb

When analyzing or debugging complex code it can be a great help to have a call graph at your disposal. In this article we look at Python's bundled trace module to generate a call graph and at jsPlumb, a Javascript library to render an interactive visual representation.

Trace can do more than coverage analysis

In a previous article we saw how we could use Python's trace module to see which lines in in our code where actually executed when we run some function. The same module can provide us with a list of functions that are called by other functions. This is as simple as providing some extra parameters as can be seen in the example code below:
import trace
 
t=trace.Trace(count=1,trace=0,countfuncs=1,countcallers=1)
t.runfunc(f)
r=t.results()
This snippet will run the function f and in the end we will have a CoverageResults object in r. We can print these results with the write_results() method but a more graphical representation is preferred. Now the underlying data structures are not well documented some inspection and examination of the source code shows that we have a member called callers that hold a record of which function called which. It is a dictionary with a a complex key and a simple value: the value contains a count of how many times in a function another function is called, the key is a tuple of tuples (caller, callee) where eacht member has three parts: (module, filename, functionname). Lets see how we can use this information to visualize the call graph.

jsPlumb
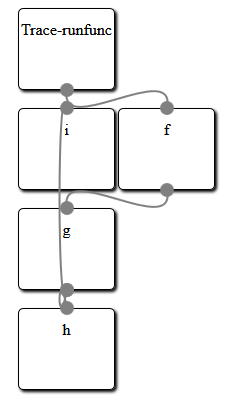
The idea is to represent each function as a simple box and draw lines to indicate which function calls which other function. Now we could try to build an application based on some graphics library but rendering graphical boxes is something web browser are good at, so why not use HTML to represent our graph and a web browser to render the stuff? All we need is some way to draw attractive lines connecting those boxes. Enter jsPlumb, a versatile Javascript libraray to do just that. And a lot more as well: once a graph is drawn it lets you interact with the boxes to rearrange them as you see fit.
The example code provided at the end of this article will generate a number of div elements, one for each Python function encountered. It also generates a bit of Javascript to let jsPlumb draw its connecting lines. The HTML produced looks like this:
<html><head>
<script type="text/javascript" src="http://explorercanvas.googlecode.com/svn/trunk/excanvas.js"></script>
<script type="text/javascript" src="http://ajax.googleapis.com/ajax/libs/jquery/1.4.4/jquery.min.js"></script>
<script type="text/javascript" src="http://ajax.googleapis.com/ajax/libs/jqueryui/1.8.2/jquery-ui.min.js"></script>
<script type="text/javascript" src="jquery.jsPlumb-1.2.5-all-min.js "></script>
<link rel="stylesheet" href="callgraph.css" type="text/css" media="all" />
</head><body>
<div id="i" class="box" style="left:200px;top:200px">i</div>
<div id="h" class="box" style="left:200px;top:400px">h</div>
<div id="Trace-runfunc" class="box" style="left:200px;top:100px">Trace-runfunc</div>
<div id="g" class="box" style="left:200px;top:300px">g</div>
<div id="f" class="box" style="left:300px;top:200px">f</div>
<script>
jsPlumb.Defaults.Connector = new jsPlumb.Connectors.Bezier(50);
jsPlumb.Defaults.DragOptions = { cursor: 'pointer', zIndex:2000 };
jsPlumb.Defaults.PaintStyle = { strokeStyle:'gray', lineWidth:2 };
jsPlumb.Defaults.EndpointStyle = { radius:7, fillStyle:'gray' };
jsPlumb.Defaults.Anchors = [ "BottomCenter", "TopCenter" ];

$("#Trace-runfunc").plumb({target:"f"});
$("#g").plumb({target:"i"});
$("#f").plumb({target:"g"});
$("#g").plumb({target:"h"});
</script>
</body></html>
It consists of a number of script tags to include the jQuery library and jsPlumb together with the explorer canvas so everything will work on Internet Explorer just as well.
Next is a list of div elements with a box class and a final script elements that calls the plumb method for each connection. This final bit of Javascript is preceded by a few lines that set some default for the lines that will be drawn. These are fully documented on the jsPlumb site.
When this HTML and Javascript is viewed with a webbrowser the result looks something like the image preceding the HTML sample code. Creating a layout for a graph where nothing overlaps is a difficult job and clearly fails here, but the beauty of jsPlumb is that it provides an interactive graph: you can click and drag any box on the screen to rearrange the graph in any way. An example is shown in the image on the left where we have dragged about some of the boxes to provide a clear separation.

From CoverageResults to an interactive graph

So our problem boils down to generating suitable HTML and Javascript from the data provided in the CoverageResults object. I'll provide the full code without much explanation as it should be clear enough. It certainly isn't a sterling example of clean coding but it works:
def f():
 for i in range(10):
  g(i)
  
def g(n):
 return h(n)+i(n)

def h(n):
 return n+10

def i(n):
 return n*8
 
def box(name,pos=(400,300)):
 return ('<div id="%s" class="box" style="left:%dpx;top:%dpx">%s</div>'
   %(name,pos[0],pos[1],name))

def connect(f,t):
 return '$("#%s").plumb({target:"%s"});'%(f,t)

if __name__ == "__main__":
 import trace
 from random import randint
 
 t=trace.Trace(count=1,trace=0,countfuncs=1,countcallers=1)
 t.runfunc(f)
 r=t.results()

 print("""<html><head>
<script type="text/javascript" src="http://explorercanvas.googlecode.com/svn/trunk/excanvas.js"></script>
<script type="text/javascript" src="http://ajax.googleapis.com/ajax/libs/jquery/1.4.4/jquery.min.js"></script>
<script type="text/javascript" src="http://ajax.googleapis.com/ajax/libs/jqueryui/1.8.2/jquery-ui.min.js"></script>
<script type="text/javascript" src="jquery.jsPlumb-1.2.5-all-min.js "></script>
<link rel="stylesheet" href="callgraph.css" type="text/css" media="all" />
</head><body>""")

 boxen={} # unique names, values are positions
 for f,t in r.callers:
  fk=f[2].replace('.','-') # identifiers with dots cannot be used as (x)html ids
  tk=t[2].replace('.','-')
  if not fk in boxen:
   boxen[fk]=[200,100]
  if not tk in boxen:
   boxen[tk]=[200,100]
  boxen[tk][1]=boxen[fk][1]+100
 for b in boxen:
  for b2 in boxen:
   if b != b2 and boxen[b] == boxen[b2]:
    boxen[b2][0]+=100
 for b in boxen:
  print(box(b,boxen[b]))

 print("""<script>
jsPlumb.Defaults.Connector = new jsPlumb.Connectors.Bezier(50);
jsPlumb.Defaults.DragOptions = { cursor: 'pointer', zIndex:2000 };
jsPlumb.Defaults.PaintStyle = { strokeStyle:'gray', lineWidth:2 };
jsPlumb.Defaults.EndpointStyle = { radius:7, fillStyle:'gray' };
jsPlumb.Defaults.Anchors = [ "BottomCenter", "TopCenter" ];
""")
 for f,t in r.callers:
  fk=f[2].replace('.','-')
  tk=t[2].replace('.','-')
  print(connect(fk,tk))
 print("</script>")
 print("</body></html>")

Python and Javascript, using the Flot plugin, part 6

In the sixth installment of this series we look at how we can make the graph more interactive by making full use of the extensibility of the Flot plugin.

Creating interactive plots

The Flot plugin mimics most other jQueryUI plugins in that although it works perfectly well without any configuration options it also provides a number of ways to extend its functionality. Here we will see how we may attach a hovering label to any point in the graph, something that may prove useful if the graph consists of many points. An example is shown in this image (the mousepointer itself is not visible in this screenshot):

  var p = $.plot($("#tempandwind")  ,da ,{
    series: { lines: { show: true }, points: { show: true } },
    xaxis : { mode:"time",ticks:12,twelveHourClock:false},
    y2axis: { position:"right"},
    grid  : { hoverable: true }
  });

  $("#tempandwind").bind("plothover",highlight);

The Flot plugin does not generate the custom plothover events by defaults so we need to turn that on as can be seen in line 5. With plothover events enables we can now bind a function to this event as can be seen in the last line.

The Flot website shows a number of interesting examples on how to enhance an extend the Flot plugin. The highlight() we define here is a slightly adapted version of some of the Javascript behind this example. Lets have a look at our implementation:

var previousPoint = null;

function highlight(event, pos, item) {

  if (item) {
    if (previousPoint != item.dataIndex) {
      previousPoint = item.dataIndex;

      $("#tooltip").remove();
      var y = item.datapoint[1].toFixed(2);
               
      showTooltip(item.pageX, item.pageY,
        item.series.label + " = " + y);
    }
  } else {
    $("#tooltip").remove();
    previousPoint = null;   
  }
};

Any function bound to the plothover event is passed three arguments: an event object, the position in the canvas and an item argument that holds graph specific data, i.e. the x and y values of the datapoint that we are hovering above, its coordinates in the canvas and the label of the dataseries that the point belongs to. If item is null or undefined we are not hovering above a datapoint. We check for this in the code and remove the tooltip if so.

Because we do not want to redraw the hovering information if we are still above the same data point we check if the index in the series of datapoints is different from the one we stored in the global variable previousPoint. If this is the case, we remove the tooltip, convert the value of the datapoint to a number with only two decimals to keep things readable and call the showTooltip() function to draw the a label at to correct position.

function showTooltip(x, y, contents) {
  $('
' + contents + '
').css( { position: 'absolute', display: 'none', top: y + 5, left: x + 5, border: '1px solid #fdd', padding: '2px', 'background-color': '#fee', opacity: 0.80 }).appendTo("body").fadeIn(200); };

The showTooltip() function is straight from the example on the Flot page but deserves some explanation because it shows off some nifty jQuery features.

It creates a div element ans styles it directly with the css() method. Its display attribute is initially none as the element is added to the body element with the appendTo() method but is made gradually visible with the fadeIn() method. Each of these methods returns the element it is operating on so all methods can be chained.

Python and Javascript: using the Flot plugin, part 5

Using the Flot plugin

In article 5 of this series we look at how we may actually configure the Flot plugin to show the data.

The Javascript code: minimalweather.js

Let's have a look at a rather minimal implementation of the client side of our app. It will only show temperature and wind speed but it is a rather good example of what is possible. The Javascript code is encapsulated in a jQuery $(document).ready() function. This way we ensure that we only convert HTML elements to jQuery widget when we're absolutely sure they are present.

The first step we take is setting some general AJAX parameters. We set cache to false which will instruct jQuery to add a _ (underscore) parameter to every AJAX call. This parameter will have a random value and this will make the URL different each time, thereby preventing the browser to cache result. After all we are not interested in stale weather data. We also set async to false. AJAX calls normally return immediately but signal completion to a function that is given to them as a parameter. However, because our graphs consist of multiple dataseries we want to retrieve the data from more than one datasource. To draw the complete graph we need all data to be available, so by setting async to false we don't start doing anything else unless the last AJAX call is finished. This is a bit against the grain (after all the first A in AJAX stands for asynchronous) but it does make out code simpler.

The second task is to set a default for the reporting period and level of detail in the graphs. The period might be a day, a week or a month and the default level of detail is a average value per hour. PyWWS compatible weather stations are normally capable of logging in a much finer detail and that is what we retrieve if detail is set to raw. (My weather station can log a value every five minutes).

Next we define two functions: hourly(), that will issue two getJSON() calls to retrieve temperature and windspeed averages over the last hour and raw() that will do the same but for 5 minute intervals. Because we designed the server side of the application to produce JSON serialized data all the hard work of converting this data to arrays of timestamp/value pairs in a safe way is done by the getJSON() function which will pass the result as the data argument to the function it calls on completion.

$(document).ready(function(){
  $.ajaxSetup({cache:false,async:false});

  var temp_out;
  var wind_ave;
  
  var period="day";
  var detail="hourly";
   
  function hourly(){
   $.getJSON('./hourly/temp_out' ,{"period":period},
   function(data){ temp_out = data; });
   $.getJSON('./hourly/wind_ave' ,{"period":period},
   function(data){ wind_ave = data; });
   }
  
  function raw(){
   $.getJSON('./raw/temp_out' ,{"period":period},
   function(data){  temp_out = data; });
   $.getJSON('./raw/wind_ave' ,{"period":period},
   function(data){  wind_ave = data; });
  }

Now that we have functions in place to retrieve data we need something to convert these two data sets (temperature and wind speed) to an object that can be passed as an argument to the Flot plugin. That is what the setdata() function does: it creates an object that defines two dataseries with an appropriate label. It also defines a second y-axis to use by the wind speed dataseries. We initialize the da variable to hourly data.

  var da;
  
  function setdata(){
   da = [
    {data:temp_out,label:"temperature"},
    {data:wind_ave,label:"wind",yaxis:2}
    ];
  };
   
  hourly();
  setdata();

With the data present and a data argument ready we can finally convert the div with the tempandwind id to a graph. The flot plugin is a little different from most plugins as it does not provide a member function on any jQuery selection (unlike for example the button plugin which can be called as $("#mybutton").button() ). The Flot plugin just provides a plot() function which is passed a jQuery selection as its first argument. The second argument is an object which describes the data series and the final argument is an option object. Here we configure all series to show lines as well as points and configure the x-axis to behave as a time axis with a maximum of twelve tick marks. If it decides to show hours as ticks we inform it to use a 24 hour clock (it might show days as well, it decides that automatically although this may be set explicitly). Note that the width and height of the HTML element that we want to convert to a graph must be set explicitly beforehand. We have take care of that in the HTML contained in the basepage.html file.

  
  var p = $.plot($("#tempandwind")  ,da ,{
    series: { lines: { show: true }, points: { show: true } },
    xaxis : { mode:"time",ticks:12,twelveHourClock:false},
    y2axis: { position:"right"}
  });

We will also configure some buttons to let the user interact with the graph so we must define some way to reload and redisplay data. We therefore define a replot() function which will retrieve either hourly data or detailed data based on the contents of the detail variable and then create a new data description object. We then use the setData() method of the Flot plugin to indicate we have new data and its setupGrid() method to recalculate things like axes and ticks. The graph is then redrawn by calling the draw() method.

  function replot(){
 if (detail == "hourly") {
  hourly();
 }else{
  raw();
 }
 setdata(); 
 p.setData(da);
 p.setupGrid();
 p.draw();
  };

Interaction with the graph is now a simple matter of binding functions to click events. These functions set either the detail or the period variable to a suitable value and then call the replot() function.

  
 $("#d2").click(function(){
  detail="raw";
  replot();
 });

 $("#d1").click(function(){
  detail="hourly";
  replot();
 });

 $("#p1").click(function(){
  period="day";
  replot();
 });
 
 $("#p2").click(function(){
  period="week";
  replot();
 });
 
 $("#p3").click(function(){
  period="month";
  replot();
 });

What is left (although we could have done it much earlier) is to style the tabs and buttons with regular jQueryUI widgets:

 
 $("#tabs").tabs();
 $("#detail").buttonset();
 $("#period").buttonset();
});

The result of all this work is a functional web application that shows temperature and wind speed on its first tab:

And it is interactive of course: Clicking the week button for example results in this overview:

Of course we there is a lot more we can do but that is covered in coming articles.

Other parts of this series

Python and Javascript: using the Flot plugin

Good graphs are not only about data, they should look good as well to attract attention. The Flot plugin for jQuery produces excellent graphs, is simple to use and shows nicely how to marry Python and Javascript.

In my opinion when designing a web application, the client side (the stuff that happens in the browser) is often not receiving the attention it deserves. Sure enough we design for low latency using AJAX and mimic screen interactions of regular applications as close as possible but often is still feels like we're looking a old web page.

One of the areas that can benefit tremendously from a well chosen library is graphs. In the coming months I will try to describe a simple web application that displays data from a weather station. The server side is all python of course and will make use of the PyWWS library to acquire the data. On the client side will employ Flot, a jQuery pluging that can produce attractive graphs in simple manner. A sample of the first draft of the app is show below:

In later articles I will show how to implement both server and client side.

The universal feedparser

Sometimes things don't have to be difficult. For example, incorporating a RSS feed summary in another website. With the universal feedparser this takes only a few lines of code.

The universal feedparser is a old but venerable piece of software that makes it a walk in the park to retrieve information from an RSS or Atom feed in Python.

The following code is what I actually use to incorporate the title and first paragraph of the postings on this blog on my homepage.

import feedparser
import re

firstp=re.compile(r'^.*?<p>(.*?)</p>')

url="http://michelanders.blogspot.com/feeds/posts/default"
feed=feedparser.parse(url)

print '<h2><a href="%s">%s</a></h2>'%(feed.feed.link,feed.feed.title)
print '<div class="feeditemlist">'
for e in feed.entries:
        mo=firstp.search(e.description)
        short=mo.group(1) if not mo is None else 'no summary available'
        date="-".join(map(str,e.updated_parsed[:3]))
        summary='<p>%s</p><a href="%s">read more</a>'%(short,e.link)
        print '''
        <h3><a href="#">
        <span class="feeditemdate">%s</span>
        <span class="feeditemtitle">%s</span>
        </a></h3>
        <div class="feeditemsummary">%s</div>'''%(date,e.title,summary)
print '</div>'

The html this script produces is easily readable by itself but can simply be converted to a jQueryUI Accordion widget to save space.

The only drawback is that the universal feed parser only works with Python 2.x