Showing posts with label Web development. Show all posts

A jQuery Mobile SelectorImage plugin

I implemented a jQueryMobile plugin to enhance a <select> element with a clickable image map. A full article with examples is available on on my site

A simple, JavaScript only implementation of an clickable image map.

In this age of html5 it is of course not done to use clickable image maps :-) Yet I did want to enhance <select> elements with clickable images to allow for a visual alternative for a drop down list without the hard to maintain imagemaps of old. I therefore implemented a jQueryMobile plugin that takes two maps (these are specified with data- attributes): one to display to the user and one to act as a definition of hotspots. These hotspots are simply colored areas in the hotspot map (instead of polygon definitions in an image map), When the user clicks the image the corresponding location is checked in the hotspot map and the color found is looked up in the list of <option> elements. If there is a match, that option is selected. A working example can be found here. A full explanation, including a small list of known problems can be found here.

Implementing a HTTPS server in Python

Web applications often transfer sensitive data between client and server. Even a session id is not something that should be vulnerable to eavesdropping. It is therefore a very good idea to encrypt all communication and implement a HTTPS server.

Subclassing HTTPServer

Python's ssl module has been cleaned up quite a bit since version 3.x and with a little help from this recipe it was incredibly simple to adapt the HTTPServer class from the http.server module to accept only secure connections:

import ssl
import socket
from socketserver import BaseServer
from http.server import HTTPServer
  
class HTTPSServer(HTTPServer):
 def __init__(self,address,handler):
  BaseServer.__init__(self,address,handler)
  
  self.socket = ssl.SSLSocket(
   sock=socket.socket(self.address_family,self.socket_type),
   ssl_version=ssl.PROTOCOL_TLSv1,
   certfile='test.pem',
   server_side=True)
  self.server_bind()
  self.server_activate()

All we do basically is change the initialization code to create a secure socket instead of a regular one (in line 10). The things to watch out for is the ssl_version: older versions are considered unsafe so we use TLS 1.0 here. Also the certificate file we use here contains both our certificate and our private key. If you want to use a self signed certificate for testing purposes you could generate one with openssl (most UNIX-like operating systems offer binary packages, for a precompiled package for windows check the faq.)

openssl req -new -x509 -keyout test.pem -out test.pem -days 365 -nodes

Note that your browser will still complain about this certificate because it is self signed.

Managing a session id with cookies

When managing sessions in web applications the key to the castle is a sessionid. Most often this sessionid is passed to and from the client by means of a cookie. In this article we explore the tools available in Python to deal with cookies.

Reading and writing cookies

If we are extending the BaseHTTPRequestHandler class from Python's http.server module we have access to the request headers by means of the headers attribute. It provides a convient method get_all() to retrieve headers by name (line 12 in the code sample below):

from http.cookies import SimpleCookie as cookie
...
class ApplicationRequestHandler(BaseHTTPRequestHandler):
 
 sessioncookies = {}

 def __init__(self,*args,**kwargs):
  self.sessionidmorsel = None
  super().__init__(*args,**kwargs)
  
 def _session_cookie(self,forcenew=False):
  cookiestring = "\n".join(self.headers.get_all('Cookie',failobj=[]))
  c = cookie()
  c.load(cookiestring)
  
  try:
   if forcenew or self.sessioncookies[c['session_id'].value]-time() > 3600:
    raise ValueError('new cookie needed')
  except:
   c['session_id']=uuid().hex
  
  for m in c:
   if m=='session_id':
    self.sessioncookies[c[m].value] = time()
    c[m]["httponly"] = True
    c[m]["max-age"] = 3600
    c[m]["expires"] = self.date_time_string(time()+3600)
    self.sessionidmorsel = c[m]
    break

The way we call get_all() provides us with an empty list if there are no cookies in the headers. Either way we end up with a (possibly empty) string that contains the cookies the client sent us. This cookie (or cookies) can be converted to a SimpleCookie object from Python's http.cookie module (line 14).

Cookies are basically key/value pairs with some extra attributes. The whole ensemble is called a morsel. The SimpleCookie object acts as a dictionary that indexes those morsels by key. The whole excersize is aimed at maintaining a session id so we check if our cookie object holds a session_id morsel and use its value (a GUID) as an index into the sessioncookies class variable. This class variabele maintains a dictionary indexed by the GUIDs of the session id cookies we produced. The corresponding values are their timestamps. Line 17 will therefore raise an exception if

  • no session_id cookie was provided by the client,
  • the session_id is unknown to us,
  • the session_id is expired, i.e. older than one hour, or
  • when we explicitely indicated we want a new cookie, no matter what.
In those cases we generate a complete new, random, GUID and store its hexadecimal representation.

At this point we are guaranteed to have a SimpleCookie object that contains a session_id. Our final tasks are to store the timestamp of this cookie and to update or set some additional attributes on this morsel. The client might have sent more than one cookie so we iterate over all morsel and stop at the first session_id morsel we find. We set its httponly attribute to signal to the browset that this cookie should not be manipulated by any client side JavaScript and set both its expires attribute and its max-age before we store this specific morsel in an instance variabele. This way we can add this cookie to the response headers one we have processed the request. An outline is sketched in the snipper below:

...
 def do_GET(self):
  ...
  self._session_cookie()
  ...
  if not (self.sessionidmorsel is None):
    self.send_header('Set-Cookie',self.sessionidmorsel.OutputString())
  ...

Security considerations

At this point we have a tool to manage a session id. Such a session id can be used as a key to access other session information, a topic we cover in a later article. Before we even start thinking of using this we should consider the security issues.

Pythonsecurity.org has a handy checklist that will walk through:

Are session IDs exposed in the URL?
No, we use cookies and those are part of the HTTP headers.
Do session IDs timeout and can users log out?
Our session IDs certainly timeout but providing a log out option should be part of the web application.
When a user logs out or times out, is the session invalidated?
At this point we only dealing with session ids.
Are session IDs rotated after successful login?
That is why we provide the forcenew paramter. After a successful login the web application should call _session_cookie() again with forcenew=True
Are session IDs only sent over TLS/SSL?
That should be implemented in the HTTP server, here we only look at the request handling part.
Are session IDs completely randomly generated?
We use a variant 4 uuid from Python's uuid module which should be completely random. The documentation makes no claims about the quality of the random generator used but a quick look at the code of the uuid module (in Python 3.2) reveals that is uses either system provided functions or the built-in random() function. In other words, we don't know what we get and that is bad! It is probably better use os.urandom() directly which will raise a NotImplentedError if a source of randomness couldn't be found. Generating a a string of 32 hex digits might be done as follows: "%02x"*16%tuple(os.urandom(16))

Erica web application framework

I started developing and writing about a new Python web application framework in Python to aid people in understanding concepts in web application development.

Erica web application framework

The framework is named after one of our cutest pygmy goats, Erica, which is of course completely irrelevant :-). More important is that the first article outlining the goals, is already on-line on my website. The articles will build and extend on blog entries made in this blog. The idea is that the website will develop into a small but comprehensive tutorial on implementing a framework while this blog will be the place to watch for updates and place your comments.

Implementing POST method handling in a web application server

In an ongoing project to implement a web application server that is as simple as possible we now implement handling POST requests

Handling POST requests

The HTTP POST method is often the preferred way to transfer information from a form to the server. If we use POST the arguments don't end up in the webserver log for example and it allows us to use a file upload tag.

Depending on the encoding attribute of a form element, POST data might be encode as a number of key/value pairs (one on each line) or a multipart MIME message (useful if you want to upload files). More information can be found here.

Wielding the power of Python's cgi module

Decoding a multipart MIME message isn't trivial but lucky for us we can offload the hard work to an existing module: cgi. It is part of the standard Python distribution and although designed to implemented cgi scripts we can co-opt its functionality for our purpose. All we have to do is add a do_POST() method to our ApplicationRequestHandler class as shown below:

from cgi import FieldStorage
from os import environ

class ApplicationRequestHandler(BaseHTTPRequestHandler):

	def do_POST(self):
		ob=self._find_app()
		
		environ['REQUEST_METHOD'] = 'POST'
		fs=FieldStorage(self.rfile,headers=self.headers)
		kwargs={}
		for name in fs:
			for i in fs.getlist(name):
				if fs[name].file:
					kwargs[name] = fs[name].file
					kwargs[name].srcfilename = fs[name].filename
				else:
					kwargs[name] = fs[name]
		
		return self._execute(ob,kwargs)

We factored out some common code that is also used in the do_GET() method (in the _find_app() and _execute()methods, not shown here), but basically we instantiate a cgi.FieldStorage instance and pass it the input filestream along with a dictionary of the HTTP headers we have enounterd so far. Because the cgi module expects some parameters to be present in the environment we set the REQUEST_METHOD to POST because that information not part of the headers. The FieldStorage instance returned can be used as dictionary with the names of the parameters as keys.

Any file input parameters are a bit special. The contents of the uploaded file are stored in a temporary file and if we would access this parameter the value would be the contents of this file as a byte object. We'd rather pass on the temporary file object to prevent passing around the contents of really big files unnecessarily. We can check if a parameter is an uploaded file by checking its file parameter (line 14). If the argument is a file, we tack on the original file name (that is, the one the user's PC) because we might want to use that later. The final line passes the arguments we have extracted to the _execute() method. This method is factored out from the do_GET() method. It locates the function to execute and checks its arguments against any annotations

Function annotations in Python, checking parameters in a web application server , part II

In a previous article I illustrated how we could put Python's function annotations to good use to provide use with a syntactically elegant way to describe which kind of parameter content would be acceptable to our simple web application framework. In this article the actual implementation is presented along with some notes on its usage.

A simple Python application server with full argument checking

The applicationserver module provides a ApplicationRequestHandler class that derives from the Python provided BaseHTTPRequestHandler class. For now all we do is provide a do_GET() method, i.e. we don't bother with HTTP POST methods yet, although it wouldn't take too much effort if we would.

The core of the code is presented below:

class ApplicationRequestHandler(BaseHTTPRequestHandler):
 
 def do_GET(self):
  url=urlsplit(self.path)
  path=url.path.strip('/')
  parts=path.split('/')
  if parts[0]=='':
   parts=['index']
   
  ob=self.application
  try:
   for p in parts:
    if hasattr(ob,p):
     ob=getattr(ob,p)
    else:
     raise AttributeError('unknown path '+ url.path)
  except AttributeError as e:
   self.send_error(404,str(e))
   return
   
  if ('return' in ob.__annotations__ and 
   issubclass(ob.__annotations__['return'],IsExposed)):
   try:
    kwargs=self.parse_args(url.query,ob.__annotations__)
   except Exception as e:
    self.send_error(400,str(e))
    return
    
   try:
    result=ob(**kwargs)
   except Exception as e:
    self.send_error(500,str(e))
    return
  else:
   self.send_error(404,'path not exposed'+ url.path)
   return
   
  self.wfile.write(result.encode())

 @staticmethod
 def parse_args(query,annotations):
  kwargs=defaultdict(list)
  if query != '':
   for p in query.split('&'):
    (name,value)=p.split('=',1)
    if not name in annotations:
     raise KeyError(name+' not annotated')
    else:
     kwargs[name].append(annotations[name](value))
   for k in kwargs:
    if len(kwargs[k])==1:
     kwargs[k]=kwargs[k][0]
  return kwargs
  
The first thing we do in the do_GET() method is splitting the path into separate components. The path is provided in the path member and is already stripped of hostname and query parameters. We strip from it any leading or trailing slashes as well (line 5). If there are no path components we will look for a method called index.

The next step is to check each path component and see if its a member of the application we registered with the handler. If it is, we retrieve it and check whether the next component is a member of this new object. If any of these path components is missing we raise an error (line 16).

If all parts of the path can be resolved as members, we check whether the final path points to an executable with a return allocation. If this return allocation is defined and equal to our IsExposed class (line 22) we are willing to execute it, otherwise we raise an error.

The next step is to check each argument, so we pass the query part of the URL to the static parse_args() method that will return us a dictionary of values if all values checked out ok. If so we call the method that we found earlier with these arguments and if all went well, write its result to the output stream that will deliver the content to the client.

The parse_args() method is not very complicated: It creates a default dictionary whose default will be an empty list. This way we can create a list of values if the query consists of more than one part with the same name. Then we split the query on the & character (line 44) and split each part in a name and a value part (these are separated by a = character). Next we check if the name is present in the annotations dictionary and if not raise a KeyError.

If we did find the name in the annotations dictionary its associated value should be an executable that we pass the value from the query part (line 48). The result of this check (or conversion) is appended to the list in the default dictionary. If the value in the annotation is not an executable an exception will be raised that will not be caught. Likewise will any exception within this callable bubble up to the calling code. The final lines (line 50-53) reduce those entries in the default dictionary that consist of a list with just a single item to just that item before returning.

Conclusion

Python function annotations can be used for many purposes and this example code show a rather elegant (I think) example that let's us specify in clear language what we expect of functions that are part of web applications, which makes it quite easy too catch many input errors in an way that can be adapted to almost any input pattern.

Function annotations in Python, checking parameters in a web application server

Parameter annotations in function definitions are a recent addition to the language. In this article we show how this feature can be put to good use when we build a simple web application server that checks its input parameters rigoreously.

Creating a simple web application server with HTTPServer

It is of course entirely possible to create a web application in a short time when you use an existing Python web application framework. In previous articles and my book on web applications I've used CherryPy extensively and although I recommend it for its flexibility an ease of use, it isn't all that difficult to create a web application framework from scratch.

Python's https.server module provides us with the basic building blocks: the HTTPServer class to handle incoming connections and a BaseHTTPRequestHandler class that processes requests and returns an answer. The main part of developing an application server is therefore sub-classing the BaseHTTPRequestHandler class. The minimum it will have to provide is a do_GET() method that will return results based on any parameters it receives.

Using Python parameter annotations

CherryPy uses classes with methods that serve together as an application: requested URLs are mapped to these methods and any parameters are passed along. CherryPy uses an expose decorator to identify the methods that may be called. Non exposed methods are invisible, i.e. URLs that match those methods do not result in the invocation of that method. This behavior is what we like to mimic in our own web application server.

Another important concept in web applications is the screening of input: we would like to check that incoming data (i.e. the arguments that come along with a query) are within the range of things we deem acceptable. For example, a function that adds its arguments should reject anything that cannot be interpreted as a float. We could write code easily enough that checks any function parameters explicitly but wouldn't it be nice if there was a more syntactically pleasing way of writing this?

Enter Python's function parameter annotations. Python allows us to augment each function parameter with an expression that is evaluated when the function is defined and which is stores in the functions __annotation__ field as a dictionary indexed by parameter name. Such an annotation might be as simple a single string but it can be anything, even a function reference. This function could be called with the value we would like to pass as an parameter to check if this value is ok. This could be done before the function is actually called, for example by the do_GET() method of our request handler.

Assuming we have our applicationserver module available, let's have a look what the definition of a new web application might look like:

from http.server import HTTPServer
from applicationserver import ApplicationRequestHandler,IsExposed

class Application:

 def donothing:
  pass
  
 def index(self) -> IsExposed:
  return 'index oink'
 
 def add(self,a:float,b:float) -> IsExposed:
  return str(a+b)
 
 def cat(self,a:str) -> IsExposed:
  return ' '.join(a)
 
 def opt(self,a:int=42) -> IsExposed:
  return str(a)
  
class MyAppHandler(ApplicationRequestHandler):
 application=Application()
 
appserver = HTTPServer(('',8088),MyAppHandler)
appserver.serve_forever()
The overall idea is to subclass the ApplicationRequestHandler and assign an instance of the Application class to its application field (line 21). This applicationhandler is then passed to a HTTPServer instance that will forward incoming requests to this handler (line 24).

Our ApplicationRequestHandler will try to map URLs of the form http://hostname:8080/foo?a=1&b=2 to member functions of the Application instance. It will only consider member function with a return annotation equal to an IsExposed object. So even though we have defined a donothing() function, it will not be executed when a URL like http://hostname:8080/donothing is received.

We also use annotations to restrict input values for parameters to functions that are exposed. Remember that annotations can be any expression and here we employ that fact to annotate the a and b parameters to the add() method with a reference to the built-in float() function. Our ApplicationRequestHandler will pass an argument to any callable it finds as its corresponding annotation and will only execute the method if this callable returns a value (and not raise an exception). So a URL like http://localhost:8080/add?a=1.23&b=4.56 will return a meaningful result while http://localhost:8080/add?a=1.23&b=spam will fail with an error. Off course we are not restricted to built-in functions here: we can refer to functions that may perform elaborate checking as well, perhaps checking against regular expressions or performing lookups in database tables.

All this shows that Python's function annotations allow for a rather elegant way to describe the expected behavior of methods that perform some sort of action in a web application. In a future article I'll show how to implement the applicationserver module.

A SQLite multiprocessing proxy, part 3

In a previous article I presented a first implementation of a SQLite proxy that makes it possible to distribute the workload of multiple processes with the use of Python's multiprocessing module. In this third part of the series we try to analyze the performance of this setup.

High workload example

In our sample implementation we can vary the workload inside the processes that interact with the SQLite database by varying the size of the table that we query. A table with many rows takes more time to scan for a certain random value than a table with just a few rows.

The first graph we present here is about high workload: the table that we query is initialized with one million records. The table shows the time to complete 100 queries. The test was done on a machine with 6 processor cores and in the graph we show the results for 2 (deep purple, back) and 6 (light purple, front) worker processes and a varying number of threads.

The results are more or less what we expect: more worker processes means that the time to complete all tasks is reduced. However the number of threads is also significant. If the number of threads is less than the number of available worker process we do not reach the full potential. Basically we need at least as many threads a there are worker processes to keep those processes busy. If we have more threads than worker processes there is no more gain, in fact we see a minute increase in the time needed to complete all tasks. This might be due to the overhead of creating and managing threads in Python.

Low workload example

If we initialize our table with just a single row the workload will be negligible. If we draw a similar graph as for the high workload we see a completely different picture.

Now we see hardly any difference between 2 work processes or 6 and increasing the number of threads also has no effect. Also the data is rather noisy, i.e. varies quite a bit in a non-uniform manner, especially for the case with 2 worker processes. The reason for this behavior is not entirely clear to me, although it is obvious that because of the very small workload the time to setup communication with the worker process is a significant factor here.

Nice discounts on open source titles at Packt

Packt has an offer on open source books, both in print and as e-book, that might interest you. Check out their July offering, there certainly are some interesting titles available, including a few on Python and web development.

A SQLite multiprocessing proxy, part 2

In a previous article we decided to use Python's multiprocessing module to leverage the power of multi-core machines. Our use case is all about web applications served by CherryPy and so multi-processing isn't the only interesting part: our application will be multi-threaded as well. IN this article we present a first implementation of a multi-threaded application that hands off the heavy lifting to a pool of subprocesses.

The design

The design is centered on the following concepts:

  • The main process consists of multiple threads,
  • The work is done by a pool of subprocesses,
  • Transferring data to and from the subprocesses is left to the pool manager
Schematically we can visualize it as follows:

Sample code

We start of by including the necessary components:

from multiprocessing import Pool,current_process
from threading import current_thread,Thread
from queue import Queue
import sqlite3 as dbapi
from time import time,sleep
from random import random
The most important ones we need are the Pool class from the multiprocessing module and the Thread class from the threading module. We also import queue.Queue to act as a task list for the threads. Note that the multiprocessing module has its own Queue implementation that is not only thread safe but can be used for inter process communication as well but we won't be using that one here but rely on a simpler paradigm as we will see.

The next step is to define a function that may be called by the threads.

def execute(sql,params=tuple()):
 global pool
 return pool.apply(task,(sql,params))
It takes a string argument with SQL code and an optional tuple of parameters just like the Cursor.execute() method in the sqlite3 module. It merely passes on these arguments to the apply() method of the multiprocessing.Pool instance that is referred to by the global pool variable. Together with SQL string and parameters a reference to the task() function is passed, which is defined below:
def task(sql,params):
 global connection
 c=connection.cursor()
 c.execute(sql,params)
 l=c.fetchall()
 return l
This function just executes the SQL and returns the results. It assumes the global variable connection contains a valid sqlite3.Connection instance, something that is taken care of by the connect function that will be passed as an initializer to any new subprocess:
def connect(*args):
 global connection
 connection = dbapi.connect(*args)

Before we initialize our pool of subprocess let's have a look at the core function of any thread we start in our main process:

def threadwork(initializer=None,kwargs={}):
 global tasks
 if not ( initializer is None) :
  initializer(**kwargs)
 while(True):
  (sql,params) = tasks.get()
  if sql=='quit': break
  r=execute(sql,params)
It calls an optional thread initializer first and then enters a semi infinite loop in line 5. This loops starts by fetching an item from the global tasks queue. Each item is a tuple consisting of a string and another tuple with parameters. If the string is equal to quit we do terminate the loop otherwise we simple pass on the SQL statement and any parameters to the execute function we encountered earlier, which will take care of passing it to the pool of subprocesses. We store the result of this query in the r variable even though we do nothing with it in this example.

For this simple example we also need an database that holds a table with some data we can play with. We initialize this table with rows containing random numbers. When we benchmark the code we can make this as large as we wish to get meaningful results; after all, our queries should take some time to complete otherwise there would be no need to use more processes.

def initdb(db,rows=10000):
 c=dbapi.connect(db)
 cr=c.cursor()
 cr.execute('drop table if exists data');
 cr.execute('create table data (a,b)')
 for i in range(rows):
  cr.execute('insert into data values(?,?)',(i,random()))
 c.commit()
 c.close()

The final pieces of code tie everything together:

if __name__ == '__main__':
 global pool
 global tasks
 
 tasks=Queue()
 db='/tmp/test.db'
 
 initdb(db,100000)
 
 nthreads=10
 
 for i in range(100):
  tasks.put(('SELECT count(*) FROM data WHERE b>?',(random(),)))
 for i in range(nthreads):
  tasks.put(('quit',tuple()))
 
 pool=Pool(2,connect,(db,))
 
 threads=[]
 for t in range(nthreads):
  th=Thread(target=threadwork,kwargs={'initializer':thread_initializer})
  threads.append(th)
  th.start()
 for th in threads:
  th.join()
After creating a queue in line 5 and initializing the database in line 8, the next step is to fill a queue with a fair number of tasks (line 12). The final tasks we add to the queue signal a thread to stop (line 14). We need as many of them as there will be threads.

In line 17 we initialize our pool of processes. Just two in this example, but in general the number should be equal to the number of cpu's in the system. If you omit this argument the number will default to exactly that. Next we create (line 21) and start (line 23) the number of threads we want. The target argument points to the function we defined earlier that does all the work, i.e. pops tasks from the queue and passes these on to the pool of processes. The final lines simply wait till all threads are finished.

What's next?

In a following article we will benchmark and analyze this code and see how we can improve on this design.

A SQLite multiprocessing proxy

This is the first article in a series on improving the performance of Python web applications by leveraging the possibilities of the multiprocessing module. We'll focus on CherryPy and SQLite but the conclusions should be general enough for any Python based platform

Use case

Due to well known restrictions in the most common Python implementation, multithreading solutions will probably not help to solve performance issues (with the possible exception of serving slow network connections). The multiprocessing module offers an API similar to the threading module and might be an alternative when we want to divide the workload on a multicore machine.

The use case we're interested in is a CherryPy server that serves many requests, backed by a SQLite database. CherryPy is multithreaded by design and this approach is sensible as a web server may spend more time waiting for data to be transmitted over relatively slow network connections than actually doing work.

CherryPy however is also an excellent framework to host web applications and many web applications rely on some sort of database back-end. SQLite is a good choice for such a back-end as it comes bundled with Python (reducing the number of external dependencies), is easy to use and performs well enough. With some tricks it will even play nice in a multithreaded environment.

A disadvantage of using SQLite is that we do not have a separate database server: the SQLite engine is part of the same process that runs the Python interpreter. This means that it has the same handicap as any multithreaded application on CPython (the most common implementation of Python) and will not benefit from any extra cores or processors available on the server.

Now we could switch to MySQL or any other stand-alone database back-end but this would add quite an amount to the maintenance burden of our web application. Wouldn't it be nice if we could devise a way to use SQLite together with the multiprocessing module to have the best of both worlds: the ease of use of SQLite and the performance benefits of a stand-alone database server?

In this series of articles I will explore the possibilities and hopefully will come up with a solution that will provide:

  • a dbapi proxy (we'll use sqlite3 module but it should be general enough for any dbapi compliant database)
  • that will use the multiprocessing module to increase performance and
  • can be used from a multithreaded environment.
It would be nice if the API closely resembles the dbapi (but that is not an absolute requirement).

In the next article in this series I will explore the options to make threads and processes play nice, focusing on inter process communication.

linkcheck a Python module to check for broken links

When maintaining a web site or even when hosting a web application it makes sense to check once in a while whether there are any broken links. Here I present a simple module to find broken links in a website that is pure Python and uses no external modules.

Checking for broken links

Checking for broken links can be as simple as shown in the following example:

from linkcheck import LinkChecker

lc = LinkChecker("http://www.example.org")
if lc.check():
    if not lc.follow():
        print("there were problems")
        print("\n".join(lc.failed))
        print("\n".join(lc.other))
    else:
        print("website OK")
else:
    print("cannot open website or homepage is not html")

The check() method tries to open a URL and checks if its content is html. If this went well it returns True. The next step is to use the follow() method the see if we can open any links present in the page and report any failures. If a link points to a page containing HTML this is repeated in a recursive fashion.

The linkcheck module

We highlight some implementation details of the linkcheck module here, but the full code can be found on my website. It is licensed under the GPL and comes with a modest test suite.

The code depends on two crucial elements: LinkParser a html.parse.HTMLParser derived class and LinkChecker. LinkParser

acts on just a few HTML start tags defined in the tagrefs class variable (line 9). Its initializer is passed a baseurl argument that is used to derive relative URLs and a callback parameter that is called for each of the relevant tags that hold a reference to another URL

The LinkChecker class is discussed in detail in an an article on my website. For now I highlight just its main methods:

  • __init__(), takes just one mandatory parameter the url we start with (line 28)
  • check(), checks if the url passed to __init__() could be opened and points to a HTML file (line 38)
  • follow(), finds any links within the HTML a marks any of those links it cannot opened as failed in the failed instance variable (line 59)
  • process(), is the call back passed to an instance of the LinkParser class. It will recursively create a new LinkChecker instance to check the link for additional links. (line 67)

from urllib.request import Request,urlopen
from urllib.parse import urlsplit,urljoin,urlunsplit,urldefrag
from urllib.error import HTTPError,URLError
from html.parser import HTMLParser
from re import compile,MULTILINE,IGNORECASE

class LinkParser(HTMLParser):

 tagsrefs = { 'a':'href', 'img':'src', 'script':'src', 'link':'href' }
 
 def __init__(self,baseurl,callback):
  self.callback = callback
  self.baseurl = baseurl
  super().__init__()
  
 def handle_starttag(self, tag, attrs):
  if tag in self.tagsrefs:
   for name,value in attrs:
    if name == self.tagsrefs[tag]:
     newurl=urljoin(self.baseurl,value)
     self.callback(newurl)
     break

class LinkChecker:

 html=compile(r'^Content-Type:\s+text/html$',MULTILINE|IGNORECASE)

 def __init__(self,url,host=None,seen=None,external=True):
  self.url    = url
  self.host   = urlsplit(url).hostname if host is None else host
  self.failed = []
  self.other  = []
  self.notopened = []
  self.duplicates = 0
  self.seen = set() if seen is None else seen
  self.external = external

 def check(self,open=True):
  self.seen.add(self.url)
  if not open :
   self.notopened.append(self.url)
   return False
  try:
   self.req=urlopen(url=self.url,timeout=10)
  except HTTPError as e:
   self.failed.append(self.url)
   return False
  except URLError as e:
   self.other.append(self.url+' ('+str(e)+')')
   return False
  except Exception as e:
   print('Exception',e,type(e))
   self.failed.append(self.url)
   return False
  headers=str(self.req.info())
  m=self.html.search(headers)
  return not(m is None)
  
 def follow(self):
  parser = LinkParser(self.url,self.process)
  try:
   parser.feed(self.req.read().decode())
  except Exception as e:
   self.other.append(self.url+' ('+str(e)+')')
  return len(self.failed)+len(self.other) == 0
  
 def process(self,newurl):
  newurl=urldefrag(newurl)[0]
  if not newurl in self.seen:
   lc = LinkChecker(newurl,self.host,self.seen,self.external)
   samesite = urlsplit(newurl).hostname == self.host
   if lc.check(self.external or samesite) and samesite:
    lc.follow()
   self.failed.extend(lc.failed)
   self.other.extend(lc.other)
   self.notopened.extend(lc.notopened)
   self.seen.update(lc.seen)
   self.duplicates+=lc.duplicates
  else:
   self.duplicates+=1

Visualizing Python call graphs with jsPlumb

When analyzing or debugging complex code it can be a great help to have a call graph at your disposal. In this article we look at Python's bundled trace module to generate a call graph and at jsPlumb, a Javascript library to render an interactive visual representation.

Trace can do more than coverage analysis

In a previous article we saw how we could use Python's trace module to see which lines in in our code where actually executed when we run some function. The same module can provide us with a list of functions that are called by other functions. This is as simple as providing some extra parameters as can be seen in the example code below:
import trace
 
t=trace.Trace(count=1,trace=0,countfuncs=1,countcallers=1)
t.runfunc(f)
r=t.results()
This snippet will run the function f and in the end we will have a CoverageResults object in r. We can print these results with the write_results() method but a more graphical representation is preferred. Now the underlying data structures are not well documented some inspection and examination of the source code shows that we have a member called callers that hold a record of which function called which. It is a dictionary with a a complex key and a simple value: the value contains a count of how many times in a function another function is called, the key is a tuple of tuples (caller, callee) where eacht member has three parts: (module, filename, functionname). Lets see how we can use this information to visualize the call graph.

jsPlumb

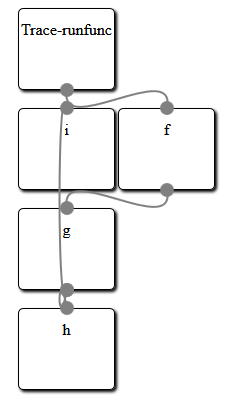
The idea is to represent each function as a simple box and draw lines to indicate which function calls which other function. Now we could try to build an application based on some graphics library but rendering graphical boxes is something web browser are good at, so why not use HTML to represent our graph and a web browser to render the stuff? All we need is some way to draw attractive lines connecting those boxes. Enter jsPlumb, a versatile Javascript libraray to do just that. And a lot more as well: once a graph is drawn it lets you interact with the boxes to rearrange them as you see fit.
The example code provided at the end of this article will generate a number of div elements, one for each Python function encountered. It also generates a bit of Javascript to let jsPlumb draw its connecting lines. The HTML produced looks like this:
<html><head>
<script type="text/javascript" src="http://explorercanvas.googlecode.com/svn/trunk/excanvas.js"></script>
<script type="text/javascript" src="http://ajax.googleapis.com/ajax/libs/jquery/1.4.4/jquery.min.js"></script>
<script type="text/javascript" src="http://ajax.googleapis.com/ajax/libs/jqueryui/1.8.2/jquery-ui.min.js"></script>
<script type="text/javascript" src="jquery.jsPlumb-1.2.5-all-min.js "></script>
<link rel="stylesheet" href="callgraph.css" type="text/css" media="all" />
</head><body>
<div id="i" class="box" style="left:200px;top:200px">i</div>
<div id="h" class="box" style="left:200px;top:400px">h</div>
<div id="Trace-runfunc" class="box" style="left:200px;top:100px">Trace-runfunc</div>
<div id="g" class="box" style="left:200px;top:300px">g</div>
<div id="f" class="box" style="left:300px;top:200px">f</div>
<script>
jsPlumb.Defaults.Connector = new jsPlumb.Connectors.Bezier(50);
jsPlumb.Defaults.DragOptions = { cursor: 'pointer', zIndex:2000 };
jsPlumb.Defaults.PaintStyle = { strokeStyle:'gray', lineWidth:2 };
jsPlumb.Defaults.EndpointStyle = { radius:7, fillStyle:'gray' };
jsPlumb.Defaults.Anchors = [ "BottomCenter", "TopCenter" ];

$("#Trace-runfunc").plumb({target:"f"});
$("#g").plumb({target:"i"});
$("#f").plumb({target:"g"});
$("#g").plumb({target:"h"});
</script>
</body></html>
It consists of a number of script tags to include the jQuery library and jsPlumb together with the explorer canvas so everything will work on Internet Explorer just as well.
Next is a list of div elements with a box class and a final script elements that calls the plumb method for each connection. This final bit of Javascript is preceded by a few lines that set some default for the lines that will be drawn. These are fully documented on the jsPlumb site.
When this HTML and Javascript is viewed with a webbrowser the result looks something like the image preceding the HTML sample code. Creating a layout for a graph where nothing overlaps is a difficult job and clearly fails here, but the beauty of jsPlumb is that it provides an interactive graph: you can click and drag any box on the screen to rearrange the graph in any way. An example is shown in the image on the left where we have dragged about some of the boxes to provide a clear separation.

From CoverageResults to an interactive graph

So our problem boils down to generating suitable HTML and Javascript from the data provided in the CoverageResults object. I'll provide the full code without much explanation as it should be clear enough. It certainly isn't a sterling example of clean coding but it works:
def f():
 for i in range(10):
  g(i)
  
def g(n):
 return h(n)+i(n)

def h(n):
 return n+10

def i(n):
 return n*8
 
def box(name,pos=(400,300)):
 return ('<div id="%s" class="box" style="left:%dpx;top:%dpx">%s</div>'
   %(name,pos[0],pos[1],name))

def connect(f,t):
 return '$("#%s").plumb({target:"%s"});'%(f,t)

if __name__ == "__main__":
 import trace
 from random import randint
 
 t=trace.Trace(count=1,trace=0,countfuncs=1,countcallers=1)
 t.runfunc(f)
 r=t.results()

 print("""<html><head>
<script type="text/javascript" src="http://explorercanvas.googlecode.com/svn/trunk/excanvas.js"></script>
<script type="text/javascript" src="http://ajax.googleapis.com/ajax/libs/jquery/1.4.4/jquery.min.js"></script>
<script type="text/javascript" src="http://ajax.googleapis.com/ajax/libs/jqueryui/1.8.2/jquery-ui.min.js"></script>
<script type="text/javascript" src="jquery.jsPlumb-1.2.5-all-min.js "></script>
<link rel="stylesheet" href="callgraph.css" type="text/css" media="all" />
</head><body>""")

 boxen={} # unique names, values are positions
 for f,t in r.callers:
  fk=f[2].replace('.','-') # identifiers with dots cannot be used as (x)html ids
  tk=t[2].replace('.','-')
  if not fk in boxen:
   boxen[fk]=[200,100]
  if not tk in boxen:
   boxen[tk]=[200,100]
  boxen[tk][1]=boxen[fk][1]+100
 for b in boxen:
  for b2 in boxen:
   if b != b2 and boxen[b] == boxen[b2]:
    boxen[b2][0]+=100
 for b in boxen:
  print(box(b,boxen[b]))

 print("""<script>
jsPlumb.Defaults.Connector = new jsPlumb.Connectors.Bezier(50);
jsPlumb.Defaults.DragOptions = { cursor: 'pointer', zIndex:2000 };
jsPlumb.Defaults.PaintStyle = { strokeStyle:'gray', lineWidth:2 };
jsPlumb.Defaults.EndpointStyle = { radius:7, fillStyle:'gray' };
jsPlumb.Defaults.Anchors = [ "BottomCenter", "TopCenter" ];
""")
 for f,t in r.callers:
  fk=f[2].replace('.','-')
  tk=t[2].replace('.','-')
  print(connect(fk,tk))
 print("</script>")
 print("</body></html>")

Python and Javascript, using the Flot plugin, part 6

In the sixth installment of this series we look at how we can make the graph more interactive by making full use of the extensibility of the Flot plugin.

Creating interactive plots

The Flot plugin mimics most other jQueryUI plugins in that although it works perfectly well without any configuration options it also provides a number of ways to extend its functionality. Here we will see how we may attach a hovering label to any point in the graph, something that may prove useful if the graph consists of many points. An example is shown in this image (the mousepointer itself is not visible in this screenshot):

  var p = $.plot($("#tempandwind")  ,da ,{
    series: { lines: { show: true }, points: { show: true } },
    xaxis : { mode:"time",ticks:12,twelveHourClock:false},
    y2axis: { position:"right"},
    grid  : { hoverable: true }
  });

  $("#tempandwind").bind("plothover",highlight);

The Flot plugin does not generate the custom plothover events by defaults so we need to turn that on as can be seen in line 5. With plothover events enables we can now bind a function to this event as can be seen in the last line.

The Flot website shows a number of interesting examples on how to enhance an extend the Flot plugin. The highlight() we define here is a slightly adapted version of some of the Javascript behind this example. Lets have a look at our implementation:

var previousPoint = null;

function highlight(event, pos, item) {

  if (item) {
    if (previousPoint != item.dataIndex) {
      previousPoint = item.dataIndex;

      $("#tooltip").remove();
      var y = item.datapoint[1].toFixed(2);
               
      showTooltip(item.pageX, item.pageY,
        item.series.label + " = " + y);
    }
  } else {
    $("#tooltip").remove();
    previousPoint = null;   
  }
};

Any function bound to the plothover event is passed three arguments: an event object, the position in the canvas and an item argument that holds graph specific data, i.e. the x and y values of the datapoint that we are hovering above, its coordinates in the canvas and the label of the dataseries that the point belongs to. If item is null or undefined we are not hovering above a datapoint. We check for this in the code and remove the tooltip if so.

Because we do not want to redraw the hovering information if we are still above the same data point we check if the index in the series of datapoints is different from the one we stored in the global variable previousPoint. If this is the case, we remove the tooltip, convert the value of the datapoint to a number with only two decimals to keep things readable and call the showTooltip() function to draw the a label at to correct position.

function showTooltip(x, y, contents) {
  $('
' + contents + '
').css( { position: 'absolute', display: 'none', top: y + 5, left: x + 5, border: '1px solid #fdd', padding: '2px', 'background-color': '#fee', opacity: 0.80 }).appendTo("body").fadeIn(200); };

The showTooltip() function is straight from the example on the Flot page but deserves some explanation because it shows off some nifty jQuery features.

It creates a div element ans styles it directly with the css() method. Its display attribute is initially none as the element is added to the body element with the appendTo() method but is made gradually visible with the fadeIn() method. Each of these methods returns the element it is operating on so all methods can be chained.

Python and Javascript: using the Flot plugin, part 5

Using the Flot plugin

In article 5 of this series we look at how we may actually configure the Flot plugin to show the data.

The Javascript code: minimalweather.js

Let's have a look at a rather minimal implementation of the client side of our app. It will only show temperature and wind speed but it is a rather good example of what is possible. The Javascript code is encapsulated in a jQuery $(document).ready() function. This way we ensure that we only convert HTML elements to jQuery widget when we're absolutely sure they are present.

The first step we take is setting some general AJAX parameters. We set cache to false which will instruct jQuery to add a _ (underscore) parameter to every AJAX call. This parameter will have a random value and this will make the URL different each time, thereby preventing the browser to cache result. After all we are not interested in stale weather data. We also set async to false. AJAX calls normally return immediately but signal completion to a function that is given to them as a parameter. However, because our graphs consist of multiple dataseries we want to retrieve the data from more than one datasource. To draw the complete graph we need all data to be available, so by setting async to false we don't start doing anything else unless the last AJAX call is finished. This is a bit against the grain (after all the first A in AJAX stands for asynchronous) but it does make out code simpler.

The second task is to set a default for the reporting period and level of detail in the graphs. The period might be a day, a week or a month and the default level of detail is a average value per hour. PyWWS compatible weather stations are normally capable of logging in a much finer detail and that is what we retrieve if detail is set to raw. (My weather station can log a value every five minutes).

Next we define two functions: hourly(), that will issue two getJSON() calls to retrieve temperature and windspeed averages over the last hour and raw() that will do the same but for 5 minute intervals. Because we designed the server side of the application to produce JSON serialized data all the hard work of converting this data to arrays of timestamp/value pairs in a safe way is done by the getJSON() function which will pass the result as the data argument to the function it calls on completion.

$(document).ready(function(){
  $.ajaxSetup({cache:false,async:false});

  var temp_out;
  var wind_ave;
  
  var period="day";
  var detail="hourly";
   
  function hourly(){
   $.getJSON('./hourly/temp_out' ,{"period":period},
   function(data){ temp_out = data; });
   $.getJSON('./hourly/wind_ave' ,{"period":period},
   function(data){ wind_ave = data; });
   }
  
  function raw(){
   $.getJSON('./raw/temp_out' ,{"period":period},
   function(data){  temp_out = data; });
   $.getJSON('./raw/wind_ave' ,{"period":period},
   function(data){  wind_ave = data; });
  }

Now that we have functions in place to retrieve data we need something to convert these two data sets (temperature and wind speed) to an object that can be passed as an argument to the Flot plugin. That is what the setdata() function does: it creates an object that defines two dataseries with an appropriate label. It also defines a second y-axis to use by the wind speed dataseries. We initialize the da variable to hourly data.

  var da;
  
  function setdata(){
   da = [
    {data:temp_out,label:"temperature"},
    {data:wind_ave,label:"wind",yaxis:2}
    ];
  };
   
  hourly();
  setdata();

With the data present and a data argument ready we can finally convert the div with the tempandwind id to a graph. The flot plugin is a little different from most plugins as it does not provide a member function on any jQuery selection (unlike for example the button plugin which can be called as $("#mybutton").button() ). The Flot plugin just provides a plot() function which is passed a jQuery selection as its first argument. The second argument is an object which describes the data series and the final argument is an option object. Here we configure all series to show lines as well as points and configure the x-axis to behave as a time axis with a maximum of twelve tick marks. If it decides to show hours as ticks we inform it to use a 24 hour clock (it might show days as well, it decides that automatically although this may be set explicitly). Note that the width and height of the HTML element that we want to convert to a graph must be set explicitly beforehand. We have take care of that in the HTML contained in the basepage.html file.

  
  var p = $.plot($("#tempandwind")  ,da ,{
    series: { lines: { show: true }, points: { show: true } },
    xaxis : { mode:"time",ticks:12,twelveHourClock:false},
    y2axis: { position:"right"}
  });

We will also configure some buttons to let the user interact with the graph so we must define some way to reload and redisplay data. We therefore define a replot() function which will retrieve either hourly data or detailed data based on the contents of the detail variable and then create a new data description object. We then use the setData() method of the Flot plugin to indicate we have new data and its setupGrid() method to recalculate things like axes and ticks. The graph is then redrawn by calling the draw() method.

  function replot(){
 if (detail == "hourly") {
  hourly();
 }else{
  raw();
 }
 setdata(); 
 p.setData(da);
 p.setupGrid();
 p.draw();
  };

Interaction with the graph is now a simple matter of binding functions to click events. These functions set either the detail or the period variable to a suitable value and then call the replot() function.

  
 $("#d2").click(function(){
  detail="raw";
  replot();
 });

 $("#d1").click(function(){
  detail="hourly";
  replot();
 });

 $("#p1").click(function(){
  period="day";
  replot();
 });
 
 $("#p2").click(function(){
  period="week";
  replot();
 });
 
 $("#p3").click(function(){
  period="month";
  replot();
 });

What is left (although we could have done it much earlier) is to style the tabs and buttons with regular jQueryUI widgets:

 
 $("#tabs").tabs();
 $("#detail").buttonset();
 $("#period").buttonset();
});

The result of all this work is a functional web application that shows temperature and wind speed on its first tab:

And it is interactive of course: Clicking the week button for example results in this overview:

Of course we there is a lot more we can do but that is covered in coming articles.

Other parts of this series

Python 3 Web Development Beginner's Guide, published!

Work on my new book, Python 3 Web Development Beginner's Guide, is done and both the e-book version and the print version are now available.

Python 3 Web Development Beginner's Guide is available now. Both the e-book version and the print version are now available on the publishers website as well as on the websites of the major on-line book stores.

Writing the book was hard work, but the attention and skills of the people at Packt Publishing and the reviewers of the book were a great help. Kudos to them!

Python and Javascript: using the Flot plugin, part 4

First steps in creating a web application

It is nice to have some modules that serve up weather data but it is of course not enough. In this article we show how to use those modules as components in a CherryPy application. We also see what the HTML looks like that we use to structure the information in the web application and load all necessary Jascript files and supporting CSS.

Serving a CherryPy application

The first steps in setting up our web application is importing the cherrypy module and the classes from the weather package that we created earlier:

import os
        
current_dir = os.path.dirname(os.path.abspath(__file__))

import cherrypy

from weather.services import Hourly,Raw,Monthly

basepage = "".join(open(os.path.join(current_dir,'basepage.html')).readlines())

In the last line we also read in a file called basepage.html that we will look at later as it forms the basis of our application (we use a separate file so that we don't have to mix to much Python and HTML. Syntax highlighters don't like that). The next step is to configure the tree of URLs that serve the different kinds of data:

class Root:

    hourly = Hourly('/home/michel/sitescripts/pywws/weatherdata')
    raw    = Raw('/home/michel/sitescripts/pywws/weatherdata')
    monthly= Monthly('/home/michel/sitescripts/pywws/weatherdata')
    
    @cherrypy.expose
    def index(self):
        return basepage

We configure the server to listen on any address and by default it will listen on port 8080. If you need another port you may configure this with the server.socket_port option.

                        
cherrypy.config.update({'global':{'server.socket_host':'0.0.0.0'}})    

Finally we start the CherryPy server by passing an instance of the Root class we defined to serve the application to the quickstart() function. We pass in additional configuration items to make sure we have a log file in a place we can access and that any reference to an URL that starts with /static is mapped to a directory with the same name relative to the location from where started the script.

If we save this script as weatherservice.py we can run it with python weatherservice.py. To test it we may direct our webserver either to the name of the host where we run the script or to localhost, e.g. http://localhost:8080/ or http://www.example.com:8080/.

cherrypy.quickstart(Root(),
        config={
            '/':{
                'log.access_file'  : os.path.join(current_dir,"access.log"),
                'log.screen'       : False
                },
            '/static':{
                'tools.staticdir.on'  :True,
                'tools.staticdir.dir' :current_dir+"/static"
                }
               }
)

Structuring data with HTML

We serve a single basic HTML page to structure all the data elements in our web application and use AJAX calls from a small piece of Javascript to fill in the actual data. The base page starts of with a head section that accomplishes several things: loading the jQuery and jQueryUI libraries, provinding access to a graphical canvas, even in Internet Explorer (that is what the conditional comments do) and load the Flot plugin. The final two lines incorporate our own application specific Javascript (weather.js) and CSS file (weather.css).
<html>
<head>
<title>Weather Overview</title>
<script src="http://ajax.googleapis.com/ajax/libs/jquery/1.5.1/jquery.min.js" type="text/javascript"></script>
<script src="http://ajax.googleapis.com/ajax/libs/jqueryui/1.8.11/jquery-ui.min.js" type="text/javascript"></script>
<link rel="stylesheet" href="http://ajax.googleapis.com/ajax/libs/jqueryui/1.8.11/themes/smoothness/jquery-ui.css" type="text/css" media="all" />
<!--[if IE]><script language="javascript" type="text/javascript" src="/static/js/flot/excanvas.min.js"></script><![endif]-->
<script language="javascript" type="text/javascript" src="/static/js/flot/jquery.flot.js"></script>
<script language="javascript" type="text/javascript" src="/static/js/weather.js"></script>
<link rel="stylesheet" href="/static/css/weather.css" type="text/css" media="all" />
</head>

The body of the HTML is structured with two div elements. The first one is structured with an unordered list in a pattern that is suitable to apply jQueryUI's tab widget. Each of the tabs contains another div, each with its own id and marked as a graph class. These we will convert to graphs with the Flot plugin later.

<body>
<div id="tabs">
  <ul>
    <li><a href="#tabs-1">Temperature and wind</a></li>
    <li><a href="#tabs-2">Humidity and rain</a></li>
    <li><a href="#tabs-3">Summary and extremes</a></li>
    <li><a href="#tabs-4">Indoor values</a></li>
  </ul>
  <div id="tabs-1">
    <div id="tempandwind" class="graph" style="width:840px;height:300px"></div>
  </div>
  <div id="tabs-2">
    <div id="humidityandrain" class="graph" style="width:840px;height:300px"></div>
  </div>
  <div id="tabs-3">
    <p>here will be a table</p>
  </div>
  <div id="tabs-4">
    <div id="indoorvalues" class="graph" style="width:840px;height:300px"></div>
  </div>
</div>

The second div will hold radio buttons to select a reporting period and the level of detail in the graphs. These will be styled as jQueryUI button widgets and fitted with click handlers to make the graphs interactive.

<div id="nav">
 <div id="period">
 <input type="radio" id="p1" name="period" checked="checked" />
 <label for="p1">Day</label>
 <input type="radio" id="p2" name="period"/>
 <label for="p2">Week</label>
 <input type="radio" id="p3" name="period" />
 <label for="p3">Month</label>
 </div>
 <div id="detail">
 <input type="radio" id="d1" name="detail" checked="checked" />
 <label for="d1">Low</label>
 <input type="radio" id="d2" name="detail"/>
 <label for="d2">High</label>
 </div>
</div>
</body>
</html>

In the next part we will look at the necessary Javascript and how to use the Flot plugin.

Other parts of this series

Python and Javascript: using the Flot plugin, part 3

In a previous article I sketched the road map for implementing a small web application to present data from a small weather station with the help of PyWWS and the Flot plug-in. In this article we show how to provide data from the pywww/DataStore module as JSON encoded information that we can use in AJAX calls.

Producing JSON encoded weather data with CherryPy

Our web application is a single web page with some added Javascript that relies on a number of services that provide JSON encoded data to AJAX calls. These services are implemented as Python classes within a CherryPy application. The first class we define is called Basic and its initializer takes a single tz argument. This will be the timezone used to display data.

class Basic:

    def __init(self,tz=pytz.timezone('Europe/Amsterdam')):
        self.tz=tz
        
    @cherrypy.expose
    def default(self,name,_=None,start=None,end=None):
        start,end = self.verifystartend(start,end)
        if name in { 'temp_out','hum_out','wind_ave',
               'wind_gust','wind_dir','rain'}:
            return self.getdata(name,start,end)

The crucial method is default(). It is exposed to the CherryPy engine with the cherrypy.expose decorator. A exposed method with the name default will receive any request that cannot be mapped to a more specific name. The name attribute will hold the final part of the URL. The _ argument will hold a random string that we simply ignore: it is added to any AJAX call by jQuery to prevent the browser from caching results. The start and stop arguments are optional and may contain a date/time argument in YYYYMMDDHH format. If the end argument is absent, it defaults to now, if the start argument is absent it defaults to 24 hours before end. These defaults are calculated by the verifystartend() method (not shown).

The next check is to see whether name is one of the known types of data in the DataStore. If all is well we simply pass the name, start and end arguments to the getdata() method that we encounter in the next section. The getdata() method is not part of the Basic class but will be provided by a mixin class called Service. The idea is that Basic and its subclasses provide web application logic to be embedded in CherryPy, while Service provides an interface to produce JSON encoded data based on the data provided by PyWWS.

We define two subclasses of Basic. The first is called Hourly and should return weather data that are the hourly averages. Its initializer takes a weatherdata argument which should point to the directory where PyWWS stores its data and an optional tz argument to hold the timezone:

class Hourly(Service,Basic):

    def __init__(self, weatherdata,
           tz=pytz.timezone('Europe/Amsterdam')):
        super().__init__(tz)
        self.datastore = DataStore.hourly_store
        self.weatherdata=weatherdata
The most important bit is that __init__() creates a datastore instance variable and initializes it to the hourly_store class from the DataStore module. The datastore and weatherdata variables will be used by the getdata() method from the Service mixin.

The Raw class is very similar to the Hourly class only its datastore variable is initialized to the data_store class from the DataStore module which produces non-averaged weather data.

class Raw(Service,Basic):

    def __init__(self, weatherdata,
           tz=pytz.timezone('Europe/Amsterdam')):
        super().__init__(tz)
        self.datastore = DataStore.data_store
        self.weatherdata=weatherdata
The Service mixin class is where all the hard work is happening. The bulk of the work is done by its getdata() method. It first creates a suitable instance of a pywws DataStore and then converts the data it retrieves from this datastore with the dumps function from the json module.
            
    def getdata(self,what,start,end):
        ds=self.datastore(self.weatherdata)
        return dumps(            
                [( self.millisecondsfromnaiveutc(
          data['idx']), data[what]) 
                 for data in ds[
                     start.astimezone(
        Service.utc).replace(
                       tzinfo=None):
                     end.astimezone(
        Service.utc).replace(
                      tzinfo=None)]
    ]
               )
The single argument to the dumps() function is a list of tuples, each consisting of a timestamp in milliseconds and a floating point value as this is the format that the Flot library expects. This data is retrieved from the datastore with the slice notation: ds[a:b] will retrieve all the data between a and b (if a and b are datetime instances).

All this work was needed to be able to request URLs like http://localhost:8080/temp_out and receive a response like [[123456,14.1],[123654,14.2],[123789,14.4]] for example.

In the next installment of this series we will look into the HTML and Javascript code needed to make this web application really work.

Other parts of this series

Python and Javascript: using the Flot plugin, part 2

In a previous article I sketched the road map for implementing a small web application to present data from a small weather station with the help of PyWWS and the Flot plugin. In this article we tackle the conversion of the pywww/DataStore module to Python 3.

Converting the pywws/DataStore module to Python 3

Because pywws is written for Python 2.x we need to convert it to Python 3 because I don't want to continue developing for Python 2.x now that many frameworks and libraries are converted to version 3. In principle the 2to3 tool should be able to do the bulk of the work but we cannot be sure before we try and test.

For our web application we will only need to use the pywws/DataStore module to get access to stored weather data and fortunately it has no dependencies on other pywws modules. Converting this module with the 2to3 tool and comparing the differences shows only 3 changes:

  • the ConfigParser module is now called configparser
  • map() returns a map object instead of a list
  • open() takes an 'r' mode argument instead of 'rb' in those cases where the result of the open() function is expected to return unicode strings instead of bytes.
The second change is the most fundamental. A map object is a generator and not a plain list. This means is has to be explicitly converted to a list if an operation expects a plain list. For an expansion from a list to a number of arguments this is correctly done by the 2to3 utility. For example, the following line
  return datetime(*map(int, (date_string[0:4],
                                    date_string[17:19])))
is translated to
  return datetime(*list(map(int, (date_string[0:4],
                                    date_string[17:19])))
All in all this is a fairly painless conversion process (but remember that I converted just the Datastore module, although with 455 lines this is pretty big). The next article will show how we implement server side component of the weather application based on PyWWS and CherryPy.

Python and Javascript: using the Flot plugin

Good graphs are not only about data, they should look good as well to attract attention. The Flot plugin for jQuery produces excellent graphs, is simple to use and shows nicely how to marry Python and Javascript.

In my opinion when designing a web application, the client side (the stuff that happens in the browser) is often not receiving the attention it deserves. Sure enough we design for low latency using AJAX and mimic screen interactions of regular applications as close as possible but often is still feels like we're looking a old web page.

One of the areas that can benefit tremendously from a well chosen library is graphs. In the coming months I will try to describe a simple web application that displays data from a weather station. The server side is all python of course and will make use of the PyWWS library to acquire the data. On the client side will employ Flot, a jQuery pluging that can produce attractive graphs in simple manner. A sample of the first draft of the app is show below:

In later articles I will show how to implement both server and client side.